
Can You Trust Your Event Advocacy Report? 6 Audit Questions
Some advocacy numbers are counted, others are estimated. Six questions that show you which is which in any event advocacy report, before you renew.
You can trust an event advocacy report when every number in it is one of two things. Measured numbers are counted actions: a post shared, a link clicked, a registration completed. Modeled numbers are estimates built from assumptions you can see and check. Both belong in a good report; the trouble starts when a modeled number is presented as if it were a measurement.
The six questions below separate the two in about fifteen minutes, for any vendor's report. Including ours.
Here's why this suddenly matters more than it used to. Event budgets are getting a harder look: US exhibition attendance has nearly recovered to 2019 levels, but inflation-adjusted revenues are still 15.6% below them, per the CEIR Index.
When money is tight, the post-event report stops being a victory lap and becomes a budget document. You'll defend a renewal with it. So it pays to know exactly which of its numbers you can stand behind.
What is the difference between a measured and a modeled number?
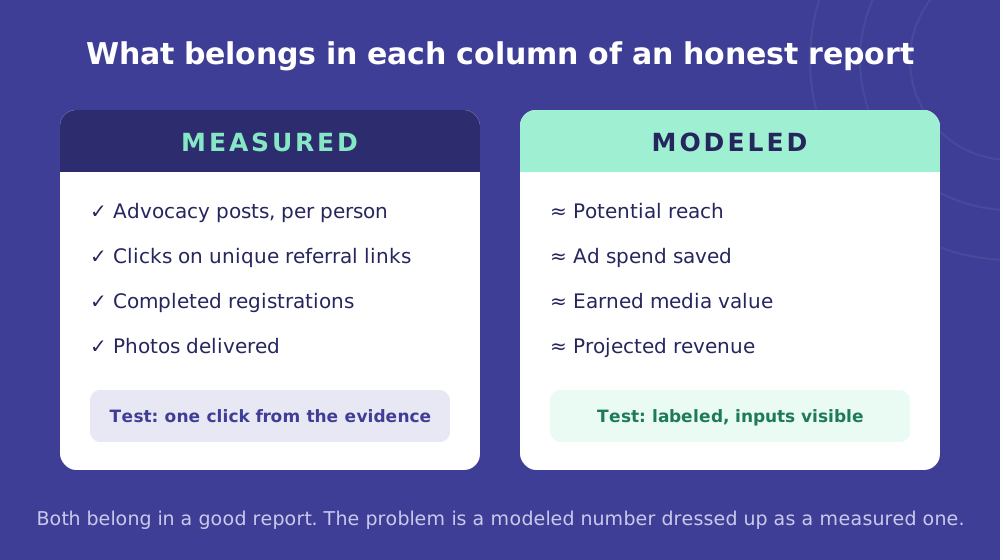
Measured: an action that happened and was logged. A specific attendee shared a poster, someone clicked their unique link, a registration completed. You can open the record behind the number and see the person, the post, the click.
Modeled: arithmetic on assumptions. Potential reach, ad spend equivalence, earned media value, projected revenue. A modeled number answers "what is this probably worth?" by multiplying measured inputs by assumed ones.
Neither type is good or bad. We publish both kinds ourselves: counted posts and referrals on one side, estimated reach and ad spend saved on the other. Every serious vendor models, because some questions (like "what would this exposure have cost as ads?") can only be answered with a model.
The line that matters is not estimated versus exact. It's labeled versus dressed up. A modeled number with its inputs on display is a forecast you can interrogate. A modeled number presented as a result is a problem, whoever publishes it.
Why does the measured-vs-modeled question matter right now?
Because the people reading your report have changed. Advocacy used to be judged by the event team alone. Now it lands in front of your CMO or Head of Marketing next to every other channel line.
And exhibitions already consume 40.8% of exhibitor marketing budgets, the single largest line item, per CEIR's 2026 Marketing Spend Decision Report. Big line items attract hard questions.
And advocacy earns its budget precisely because it's the trust channel: peer recommendations carry weight that paid media doesn't. (We've written before about why live events are B2B's most trusted marketing channel.) A trust channel reported with numbers nobody can verify undercuts its own story. The reporting has to be as credible as the channel.
And you renew or replace tools based on these reports. The audit below works just as well in a sales demo as it does on your own event marketing stack.
What are the six questions that audit any advocacy report?
Run every advocacy, referral, or peer-to-peer report through these six questions.
- Is this number measured or modeled? For every headline figure, ask one thing: did this happen, or did a formula produce it? "22,726 posts" is a count. "5.97M potential reach" is a model. Both can sit in the same report honestly, but the report should tell you which is which before you have to ask.
- Can you open the number? A measured number should be one click away from its evidence: the actual posts on actual profiles, the clicks, the completed registrations, per person. If the dashboard only shows a total with no way to reach the actions behind it, treat the total as a claim, not a count.
- For modeled numbers, are the inputs visible? Ask what was assumed: reach per person, value per impression, conversion rate. A vendor who trusts their model will show you the assumptions and let you change them to see the number move. If the formula is "proprietary," read the output as marketing copy.
- Does it pass the scale check? Divide the big number by your attendance or advocate count and ask if the per-person figure is believable. At GITEX Global 2025, the reported 5.97M+ potential reach across 32,000+ advocates works out to roughly 190 people per advocate: a believable slice of one person's network. If the division implies every attendee reached thousands of people, an assumption is doing the heavy lifting.
- Would it survive your own budget review? You will present these numbers to justify next year's spend. Any line whose only defense is "the platform said so" can't go on your slide. If you wouldn't put it in front of your leadership, don't accept it from a vendor.
- Does your own analytics agree? Open your event's Google Analytics and look at social and referral traffic to the registration page during the campaign window. It won't match the vendor dashboard click for click (attribution never does), but the direction should agree. A claimed flood of traffic your own analytics never saw is your answer.
Six questions. Fifteen minutes. You'll learn more about a vendor from this than from any demo.
Asking them isn't aggression; it's respect for the budget. A vendor who opens the dashboard and walks you through the layers is a keeper. One who can't show the measured layer under the headline gets one chance to produce it before renewal, not after.
Does the smaller, honest number ever win?
It does, and more often than you'd think. A marketing team once showed us a report they'd received from an advocacy vendor. The headline return was many times larger than any lift their own analytics could account for.
The big number didn't close the renewal. It started the doubt.
What won instead was the report they could check: smaller figures, every one traceable to a person, a post, or a registration. Their reasoning was simple. A number you can open is something you can build next year's budget on. A number you can't explain is a risk you carry into every review.
That's the scale check from question 4 doing its job in the real world. When a claim is far bigger than anything your own data can explain, you don't have to argue with it. You just ask to see the layer underneath.
What does honest advocacy reporting look like?
The simplest test of a report is whether it keeps measured and modeled in separate, labeled columns. Here's what that looks like using our own published numbers from GITEX Global 2025.
On the measured side:
- 22,726 advocacy posts (18,166 direct and 4,560 indirect)
- 3.7 referrals per advocate, tracked through each person's unique link
- 20,000+ photos delivered on-site
Each of those traces back to a person, a post, or a delivery log you can open.
On the modeled side, clearly labeled as estimates:
- 5.97M+ potential reach
- $160,000+ in ad spend saved (published as a pre-event figure)
Useful numbers, especially for sponsors thinking in media terms. But they live in their own lane, and nobody is asked to read them as counts.
And the quietly useful third category: year-over-year comparisons. GITEX 2025 drove 39.6% more advocates and 24.7% more posts than the previous year. Same event, same counting method, so the comparison is clean. If a vendor has run your event twice, this is the hardest number in the report to argue with.
That's the whole discipline. Not "never estimate." Label the estimates, show the inputs, and make the counted layer underneath openable. A report built that way survives any budget meeting, because every line has a visible origin.
The bottom line
You don't win trust with the biggest number in the category. You win it with numbers whose origin is visible: counted things you can open, and estimates that admit they're estimates. Ask the six questions of every event advocacy report you receive, whoever it comes from. A vendor with real numbers will enjoy answering them.
And if you're building your wider plan, advocacy reporting is one piece of it; our complete event marketing guide for 2026 covers where the channel fits.
Want to see what a measured-first advocacy report looks like on a live event? Check out Premagic →
Frequently asked questions
How do I know if my event advocacy numbers are real?
Check whether each number is measured or modeled. Measured numbers (posts, clicks, completed registrations) should be traceable to individual people and actions inside the dashboard, ideally one click from the evidence. Modeled numbers (potential reach, ad spend saved) are legitimate only when they're labeled as estimates and their assumptions are visible and adjustable.
What is a modeled metric in an event advocacy report?
A modeled metric is an estimate produced by combining measured inputs with assumptions, rather than a direct count of actions. Common examples are potential reach, earned media value, ad spend equivalence, and projected revenue. A modeled metric is honest when it is labeled as an estimate and the formula behind it is available for inspection.
How many referrals per advocate is a good benchmark?
Published first-party results vary with event size and audience. GITEX Global 2025 averaged 3.7 referrals per advocate across 32,000+ activated advocates, while at a much smaller Khaleej Times summit roughly 80 attendees posting personalized posters produced 690+ referrals. Judge your own program against its previous edition first; year-over-year comparison with the same counting method is the cleanest benchmark available.
Should I cross-check a vendor's advocacy report against Google Analytics?
Yes. Look at social and referral traffic to your registration page during the campaign window in your own analytics. The two systems will never match exactly, because attribution models and link tracking differ. But the trend should back up the vendor's story, and a large claimed traffic lift your own analytics never recorded is a red flag worth raising directly.